 EEA geospatial data catalogue
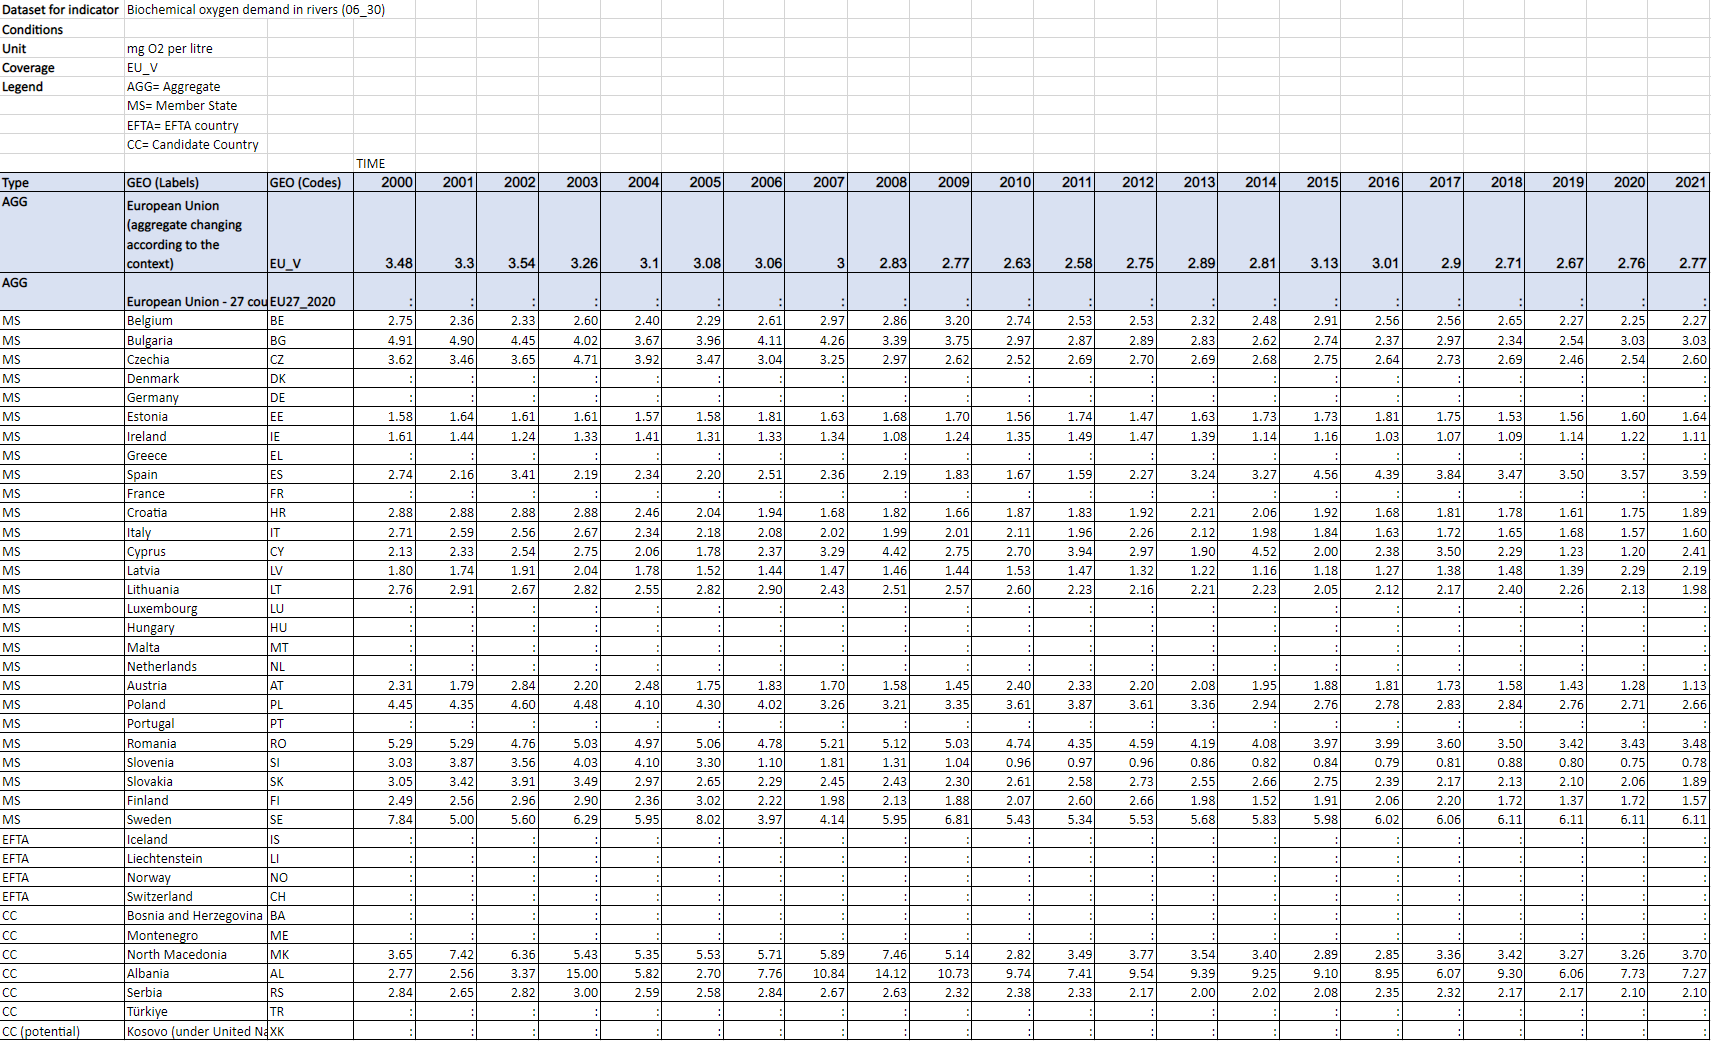
Biochemical oxygen demand in rivers (2000-2022)
The key indicators for oxygenation of water bodies are biochemical oxygen demand (BOD), which is the amount of oxygen needed by microorganisms for aerobic decomposition of organic matter. The indicator illustrates temporal trends of BOD concentration in rivers and can be used to illustrate geographical variations in current nutrient concentrations and temporal trends.
Biochemical oxygen demand (BOD) is used to measure water quality. It refers to the amount of oxygen required by aerobic microorganisms to decompose organic substances in a water sample over a period of five days in the dark at 20°C (BOD5), measured as milligrams per litre (mg O2/L) and weighted by the number of measuring stations. High values of BOD5 are usually a sign of organic pollution, which affects the water quality. The cleanest rivers have BOD5 values of less than 1 mg O2/L, moderately and heavily polluted rivers show values ranging from 2 to 8 mg O2/L. Only complete series after inter/extrapolation are presented.
Simple
Identification info
- Date (Creation)
- 2024-12-19
- Date (Publication)
- 2024-12-19
- Date (Revision)
- 2025-05-22
- Edition
-
01.00
- Citation identifier
- eea_s_eu-sdg-06-30_p_2000-2022_v01_r00
Identifier
- Point of contact
-
Organisation Individual Electronic mail address Website Role European Environment Agency
Point of contact European Environment Agency
Custodian
Extent
Temporal extent
- Time period
- 2000-01-01 2022-12-31
- Maintenance and update frequency
- Annually
- Date
- 2025-10
- Date type
- Next Update
- Continents, countries, sea regions of the world.
-
-
Spain
-
Romania
-
Belgium
-
Finland
-
Slovakia
-
Italy
-
Serbia
-
Czechia
-
North Macedonia
-
Austria
-
Bulgaria
-
Slovenia
-
Croatia
-
Poland
-
Estonia
-
Latvia
-
Lithuania
-
Cyprus
-
Albania
-
Ireland
-
EU27 (from 2020)
-
- EEA Management Plan
-
-
2024 1.1.16
-
- Available breakdowns
-
-
Country
-
- Unit of measure
-
-
mg O2 per litre
-
- Reference period
-
-
Calendar year
-
Resource constraints
- Use constraints
- Other restrictions
- Other constraints
-
License CC-BY 4.0 ( https://creativecommons.org/licenses/by/4.0/). Copyright holder: European Environment Agency (EEA).
- Language
- English
Distribution Information
- Distribution format
-
-
Microsoft Excel (.xls, .xlsx)
-
ascii (.csv, .txt, .sql)
-
- OnLine resource
-
https://sdi.eea.europa.eu/webdav/datastore/public/eea_s_eu-sdg-06-30_p_2000-2022_v01_r00
- OnLine resource
-
Direct download
- OnLine resource
-
Detailed metadata for each discodata table and column
- OnLine resource
-
BOD5 in rivers - AggregatedData
[WISE_Indicators].[v5r1].[AggregatedData]
- OnLine resource
-
Eurostat indicator: Biochemical oxygen demand in rivers
Data quality info
- Hierarchy level
- Dataset
Report
- Name of measure
-
Frequency of dissemination
- Measure description
-
Indicator is updated annually.
Result
- Value
- Every year
Report
- Name of measure
-
Timeliness
- Measure description
-
New data points are disseminated within two years after the reference year.
Result
- Value
- T+2 years
Report
- Name of measure
-
Reference area
- Measure description
-
Data are presented for all EU Member States except Denmark, Germany, Greece, France, Luxembourg, Hungary, Malta, Netherlands, Portugal and Sweden.
Result
- Value
- < 75% EU MS or no EU aggregate
Report
- Name of measure
-
Comparability - geographical
- Measure description
-
Data comparability between EU Member States respectively other presented countries is limited due to monitoring programs, including methodology and spatio-temporal sampling density, varying from country to country. The reporting is voluntary so countries do not necessarily report all available data.
Result
- Value
- < 75% EU MS
Report
- Name of measure
-
Time coverage
- Measure description
-
Presented time series (aggregate changing according to the context EU_V) starts in 2000.
Result
- Value
- > 10 years
Report
- Name of measure
-
Comparability - over time
- Measure description
-
Length of comparable time series without methodological break is longer than 4 data points.
Only complete series after inter/extrapolation are presented.
A major revision is expected by the end of 2025.
Result
- Value
- > 4 data points
Resource lineage
- Statement
-
Based on the data from WISE-6 reporting, annual mean concentrations are used as a basis in the indicator analyses. Unless the country reports aggregated data, the aggregation to annual mean concentrations is done by the EEA.
Automatic quality control procedures are applied both to the disaggregated and aggregated data, excluding data failing the tests from further analysis. In addition, a semi-manual procedure is applied, focusing on suspicious values having a major impact on the country time series and on the most recently reported data. This comprises e.g.:
• outliers;
• consecutive values deviating strongly from the rest of the time series;
• whole time series deviating strongly in level compared to other time series for that country and determinand;
• where values for a specific year are consistently far higher or lower than the remaining values for that country and determinand.
Such values are removed from the analysis and checked with the country.
For time series analyses, only complete series after inter/extrapolation are used. This is to ensure that the aggregated time series are consistent, i.e. including the same sites throughout. Inter/extrapolation of gaps up to 3 years are allowed, to increase the number of available time series. At the beginning or end of the data series, missing values are replaced by the first or last value of the original data series, respectively. In the middle of the data series, missing values are linearly interpolated. The selected time series are aggregated to country and European level by averaging across all sites for each year.
- Hierarchy level
- Dataset
Metadata
- Metadata identifier
- 535026d0-6af8-49d2-9b1a-27caa6f203d7
- Language
- English
- Character encoding
- UTF8
- Contact
-
Organisation Individual Electronic mail address Website Role European Environment Agency
Point of contact
Type of resource
- Resource type
- Non geographic dataset
- Name
-
Tabular dataset
- Metadata linkage
-
https://sdi.eea.europa.eu/catalogue/srv/api/records/535026d0-6af8-49d2-9b1a-27caa6f203d7
- Date info (Creation)
- 2024-12-17T10:03:53.835561Z
- Date info (Revision)
- 2025-10-09T10:50:34.754196Z
Metadata standard
- Title
-
ISO 19115/19139
- Edition
-
1.0
)