 EEA geospatial data catalogue
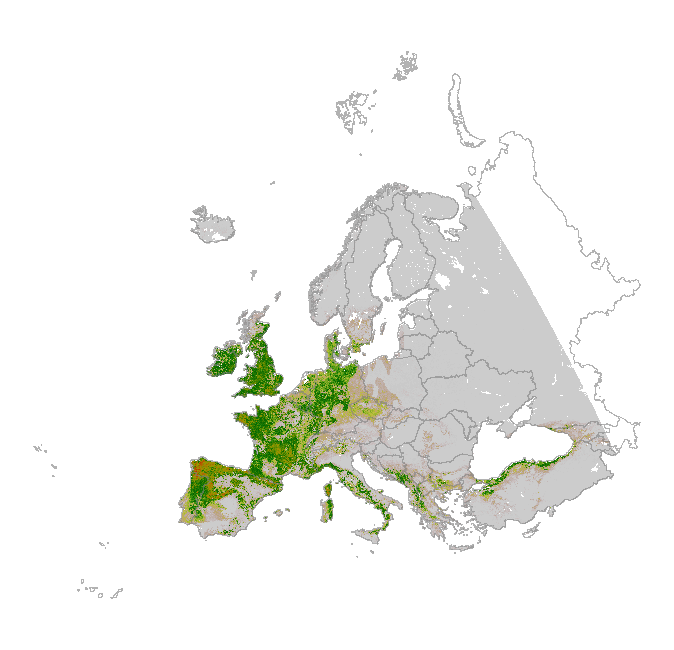
EUNIS habitat type F3.1c, predicted habitat suitability - version 1, June 2016
The modelled suitability for the EUNIS habitat type is an indication of where conditions are favourable for the habitat type based on sample plot data (Braun-Blanquet database) and the Maxent software package. The modelled suitability map may be used as a proxy for the geographical distribution of the habitat type. Note however that it is not representing the actual distribution of the habitat type.
Also note that predictions are less reliable due to data deficiency in the eastern part of Europe, and to a lesser extent to the Scandinavian countries.
Geographic restriction for plot observations: n/a
Remarks: Prediction in eastern part of Europe (Türkiye) uncertain due to lack of data for that area.
Simple
- Date (Publication)
- 2016-07-01
- Date (Creation)
- 2016-07-06
- Edition
-
01
- Citation identifier
- eea_r_3035_1_km_eunis-hab-f3-1c_p_1940-2011_v01_r00
- Status
- Obsolete
- Point of contact
-
Organisation name Individual name Electronic mail address Website Role European Environment Agency
http://www.eea.europa.eu Point of contact European Environment Agency
Custodian
Point of contact
- Maintenance and update frequency
- Unknown
-
GEMET - INSPIRE themes, version 1.0
-
-
Habitats and biotopes
-
-
GEMET
-
-
tundra
-
natural area
-
terrestrial ecosystem
-
heathland
-
- Keywords
-
- Keywords
-
- Place
-
-
Europe
-
-
EEA topics
-
-
Biodiversity
-
- Use limitation
-
EEA standard re-use policy: unless otherwise indicated, re-use of content on the EEA website for commercial or non-commercial purposes is permitted free of charge, provided that the source is acknowledged ( http://www.eea.europa.eu/legal/copyright). Copyright holder: European Environment Agency (EEA).
- Access constraints
- Other restrictions
- Other constraints
- no limitations to public access
- Spatial representation type
- Grid
- Distance
- 1 km
- Language of dataset
- English
- Character set
- UTF8
- Topic category
-
- Biota
))
- Begin date
- 1940-01-01
- End date
- 2011-12-31
- Coordinate reference system identifier
- EPSG:3035
- Distribution format
-
- GeoTIFF ( )
- OnLine resource
-
Protocol Linkage Name EEA:FILEPATH
https://sdi.eea.europa.eu/webdav/datastore/public/eea_r_3035_1_km_eunis-hab-f3-1c_p_1940-2011_v01_r00/F3-1c_ed1.tif WWW:URL
https://sdi.eea.europa.eu/data/1b6b9175-8ac9-468f-888a-1b7e19bf12a1 Direct download
- Hierarchy level
- Dataset
Conformance result
- Title
-
Commission Regulation (EU) No 1089/2010 of 23 November 2010 implementing Directive 2007/2/EC of the European Parliament and of the Council as regards interoperability of spatial data sets and services
- Date (Publication)
- 2010-12-08
- Explanation
-
See the referenced specification
- Statement
-
The database compiled for the Braun-Blanquet project is a compilation of various national and regional vegetation databases. The maintenance of these databases is in principle in the hands of the custodians. However, before uploading the databases into Braun-Blanquet database a quality check is performed by Alterra and Masaryk University. If possible, detected errors are corrected and reported back to the data provider. For the modelling of the habitat suitability map the Maxent software is used ( http://www.cs.princeton.edu/~schapire/maxent/). The grid values in the map represent the probability (ranging from 0-1) that the cell is suitable for the habitat.
The grid file represents the habitat suitability of the EUNIS type. For the modelling the widely used software Maxent for maximum entropy modelling of species’ geographic distributions was used. Maxent is a general-purpose machine-learning method with a simple and precise mathematical formulation, and has a number of aspects that make it well-suited for species distribution modelling when only presence (occurrence) data but not absence data are available (Philips et al. 2006). Because EUNIS habitats have a particular species composition, they are assumed to respond to specific ecological requirements, allowing us to generate correlative estimates of geographic distributions. Modelling habitats that have been floristically defined is a well-known procedure for ecological modelling at local scales, and a promising technique to be applied also at the continental level.
The Maxent method considers presence data (known observations of a given entity) and the so-called background data. Background data comprise a set of points used to describe the environmental variation of the study area according to the available environmental layers. It is assumed that these layers represent well the most important ecological gradients on a European scale. As layers the following environmental parameters have been used: Potential Evapotranspiration, Topsoil pH, Solar radiation, Temperature Seasonality (standard deviation *100), Mean Temperature of Wettest Quarter, Annual Precipitation, Precipitation Seasonality (Coefficient of Variation), Precipitation of Warmest Quarter & Distance to water (rivers, lakes, sea).
Statistical output of the model:
#Training samples: 666
Regularized training gain: 1.2802
Unregularized training gain: 1.3799
Iterations: 500
Training AUC: 0.9059
#Test samples: 73
Test gain: 1.0738
Test AUC: 0.8732
AUC Standard Deviation: 0.0124
#Background points: 5666
bio_12_etrs2_ras contribution: 0.4269
bio_15_etrs2_ras contribution: 2.9731
bio_18_etrs2_ras contribution: 2.3412
bio_4_etrs2_ras contribution: 66.1064
bio_8_etrs2_ras contribution: 1.2798
bld_m_sd1_1km_eu_ll contribution: 4.9566
cecsum_m_sd1_1km_eu_ll contribution: 0.0476
clyppt_m_sd1_1km_eu_ll contribution: 1.1946
crfvol_m_sd1_1km_eu_ll contribution: 2.1861
dist2water1km contribution: 0.0257
orcdrc_m_sd1_1km_eu_ll contribution: 0.1318
pet_he_yr contribution: 6.821
phihox_m_sd1_1km_eu_ll contribution: 9.5905
sltppt_m_sd1_1km_eu_ll contribution: 0.0545
sndppt_m_sd1_1km_eu_ll contribution: 1.6297
solar_1km contribution: 0.2346
bio_12_etrs2_ras permutation importance: 2.3055
bio_15_etrs2_ras permutation importance: 3.2361
bio_18_etrs2_ras permutation importance: 2.2278
bio_4_etrs2_ras permutation importance: 55.1138
bio_8_etrs2_ras permutation importance: 0.9665
bld_m_sd1_1km_eu_ll permutation importance: 6.9569
cecsum_m_sd1_1km_eu_ll permutation importance: 0.4431
clyppt_m_sd1_1km_eu_ll permutation importance: 1.4189
crfvol_m_sd1_1km_eu_ll permutation importance: 7.1748
dist2water1km permutation importance: 0
orcdrc_m_sd1_1km_eu_ll permutation importance: 0.6062
pet_he_yr permutation importance: 8.9596
phihox_m_sd1_1km_eu_ll permutation importance: 7.6888
sltppt_m_sd1_1km_eu_ll permutation importance: 0.1921
sndppt_m_sd1_1km_eu_ll permutation importance: 2.6035
solar_1km permutation importance: 0.1064
Entropy: 7.3637
Prevalence (average of logistic output over background sites): 0.1358
Fixed cumulative value 1 cumulative threshold: 1
Fixed cumulative value 1 logistic threshold: 0.04
Fixed cumulative value 1 area: 0.3789
Fixed cumulative value 1 training omission: 0.0045
Fixed cumulative value 1 test omission: 0.0274
Fixed cumulative value 1 binomial probability: 6.88E-26
Fixed cumulative value 5 cumulative threshold: 5
Fixed cumulative value 5 logistic threshold: 0.1686
Fixed cumulative value 5 area: 0.2734
Fixed cumulative value 5 training omission: 0.0255
Fixed cumulative value 5 test omission: 0.0959
Fixed cumulative value 5 binomial probability: 5.89E-34
Fixed cumulative value 10 cumulative threshold: 10
Fixed cumulative value 10 logistic threshold: 0.2755
Fixed cumulative value 10 area: 0.2238
Fixed cumulative value 10 training omission: 0.0586
Fixed cumulative value 10 test omission: 0.1233
Fixed cumulative value 10 binomial probability: 3.71E-41
Minimum training presence cumulative threshold: 0.0459
Minimum training presence logistic threshold: 0.0014
Minimum training presence area: 0.6442
Minimum training presence training omission: 0
Minimum training presence test omission: 0
Minimum training presence binomial probability: 1.08E-10
10 percentile training presence cumulative threshold: 15.122
10 percentile training presence logistic threshold: 0.365
10 percentile training presence area: 0.1936
10 percentile training presence training omission: 0.0991
10 percentile training presence test omission: 0.1918
10 percentile training presence binomial probability: 1.32E-40
Equal training sensitivity and specificity cumulative threshold: 22.4874
Equal training sensitivity and specificity logistic threshold: 0.4269
Equal training sensitivity and specificity area: 0.1624
Equal training sensitivity and specificity training omission: 0.1622
Equal training sensitivity and specificity test omission: 0.3425
Equal training sensitivity and specificity binomial probability: 9.15E-31
Maximum training sensitivity plus specificity cumulative threshold: 9.7059
Maximum training sensitivity plus specificity logistic threshold: 0.2681
Maximum training sensitivity plus specificity area: 0.2261
Maximum training sensitivity plus specificity training omission: 0.0526
Maximum training sensitivity plus specificity test omission: 0.1233
Maximum training sensitivity plus specificity binomial probability: 1.33E-40
Equal test sensitivity and specificity cumulative threshold: 15.4509
Equal test sensitivity and specificity logistic threshold: 0.3683
Equal test sensitivity and specificity area: 0.192
Equal test sensitivity and specificity training omission: 0.1021
Equal test sensitivity and specificity test omission: 0.1918
Equal test sensitivity and specificity binomial probability: 4.77E-41
Maximum test sensitivity plus specificity cumulative threshold: 10.7774
Maximum test sensitivity plus specificity logistic threshold: 0.2889
Maximum test sensitivity plus specificity area: 0.2183
Maximum test sensitivity plus specificity training omission: 0.0646
Maximum test sensitivity plus specificity test omission: 0.1233
Maximum test sensitivity plus specificity binomial probability: 1.58E-42
Balance training omission, predicted area and threshold value cumulative threshold: 1.6988
Balance training omission, predicted area and threshold value logistic threshold: 0.0686
Balance training omission, predicted area and threshold value area: 0.3449
Balance training omission, predicted area and threshold value training omission: 0.006
Balance training omission, predicted area and threshold value test omission: 0.0411
Balance training omission, predicted area and threshold value binomial probability: 1.26E-28
Equate entropy of thresholded and original distributions cumulative threshold: 4.6521
Equate entropy of thresholded and original distributions logistic threshold: 0.1577
Equate entropy of thresholded and original distributions area: 0.2783
Equate entropy of thresholded and original distributions training omission: 0.021
Equate entropy of thresholded and original distributions test omission: 0.0959
Equate entropy of thresholded and original distributions binomial probability: 4.13E-33
Metadata
- File identifier
- 1b6b9175-8ac9-468f-888a-1b7e19bf12a1 XML
- Metadata language
- English
- Character set
- UTF8
- Hierarchy level
- Dataset
- Date stamp
- 2022-01-31T13:41:07.266Z
- Metadata standard name
-
ISO 19115/19139
- Metadata standard version
-
1.0
- Metadata author
-
Organisation name Individual name Electronic mail address Website Role European Environment Agency
Point of contact
)))