 EEA geospatial data catalogue
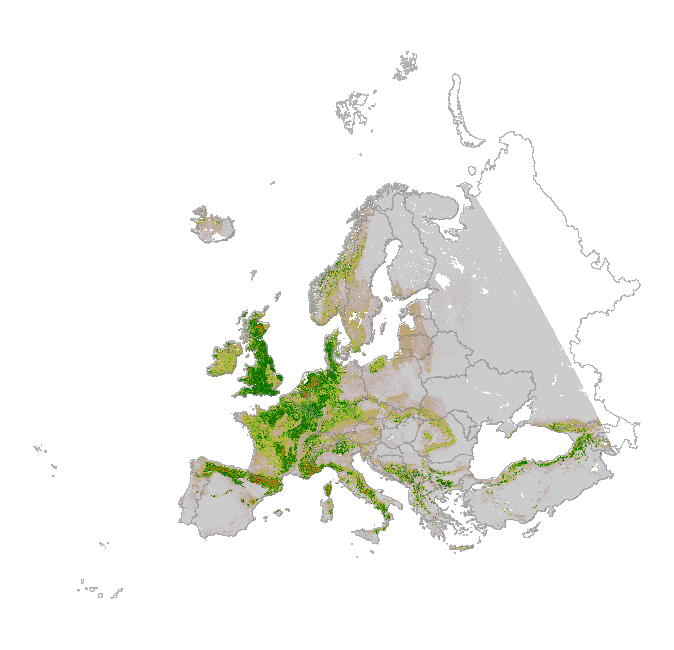
EUNIS habitat type F3.1a, predicted habitat suitability - version 1, June 2016
The modelled suitability for the EUNIS habitat type is an indication of where conditions are favourable for the habitat type based on sample plot data (Braun-Blanquet database) and the Maxent software package. The modelled suitability map may be used as a proxy for the geographical distribution of the habitat type. Note however that it is not representing the actual distribution of the habitat type.
Also note that predictions are less reliable due to data deficiency in the eastern part of Europe, and to a lesser extent to the Scandinavian countries.
Geographic restriction for plot observations: n/a
Remarks: -Prediction in eastern part of Europe (Caucasus, Türkiye) uncertain due to lack of data for that area.
Simple
Identification info
- Date (Publication)
- 2016-07-01
- Date (Creation)
- 2016-07-06
- Edition
-
01
- Citation identifier
- eea_r_3035_1_km_eunis-hab-f3-1a_p_1940-2011_v01_r00
- Status
- Obsolete
- Point of contact
-
Organisation Individual Electronic mail address Website Role European Environment Agency
Point of contact European Environment Agency
Custodian
- Spatial representation type
- Grid
Spatial resolution
- Spatial resolution
- 1 km
- Topic category
-
- Biota
Extent
))
Extent
Temporal extent
- Time period
- 1940-01-01 2011-12-31
- Maintenance and update frequency
- Unknown
- EEA topics
-
-
Biodiversity
-
- GEMET - INSPIRE themes, version 1.0
-
-
Habitats and biotopes
-
- GEMET
-
-
natural area
-
tundra
-
terrestrial ecosystem
-
heathland
-
- Place
-
-
Europe
-
Resource constraints
- Use constraints
- Other restrictions
- Other constraints
-
License CC-BY 4.0 ( https://creativecommons.org/licenses/by/4.0/). Copyright holder: European Environment Agency (EEA).
Resource constraints
- Access constraints
- Other restrictions
- Other constraints
- no limitations to public access
- Language
- English
- Character encoding
- UTF8
Data quality info
- Hierarchy level
- Dataset
Report
Result
- Title
-
Commission Regulation (EU) No 1089/2010 of 23 November 2010 implementing Directive 2007/2/EC of the European Parliament and of the Council as regards interoperability of spatial data sets and services
- Date (Publication)
- 2010-12-08
- Explanation
-
See the referenced specification
Resource lineage
- Statement
-
The database compiled for the Braun-Blanquet project is a compilation of various national and regional vegetation databases. The maintenance of these databases is in principle in the hands of the custodians. However, before uploading the databases into Braun-Blanquet database a quality check is performed by Alterra and Masaryk University. If possible, detected errors are corrected and reported back to the data provider. For the modelling of the habitat suitability map the Maxent software is used ( https://biodiversityinformatics.amnh.org/open_source/maxent/). The grid values in the map represent the probability (ranging from 0-1) that the cell is suitable for the habitat.
The grid file represents the habitat suitability of the EUNIS type. For the modelling the widely used software Maxent for maximum entropy modelling of species’ geographic distributions was used. Maxent is a general-purpose machine-learning method with a simple and precise mathematical formulation, and has a number of aspects that make it well-suited for species distribution modelling when only presence (occurrence) data but not absence data are available (Philips et al. 2006). Because EUNIS habitats have a particular species composition, they are assumed to respond to specific ecological requirements, allowing us to generate correlative estimates of geographic distributions. Modelling habitats that have been floristically defined is a well-known procedure for ecological modelling at local scales, and a promising technique to be applied also at the continental level.
The Maxent method considers presence data (known observations of a given entity) and the so-called background data. Background data comprise a set of points used to describe the environmental variation of the study area according to the available environmental layers. It is assumed that these layers represent well the most important ecological gradients on a European scale. As layers the following environmental parameters have been used: Potential Evapotranspiration, Topsoil pH, Solar radiation, Temperature Seasonality (standard deviation *100), Mean Temperature of Wettest Quarter, Annual Precipitation, Precipitation Seasonality (Coefficient of Variation), Precipitation of Warmest Quarter & Distance to water (rivers, lakes, sea).
Statistical output of the model:
#Training samples: 261
Regularized training gain: 1.451
Unregularized training gain: 1.6818
Iterations: 500
Training AUC: 0.9294
#Test samples: 28
Test gain: 1.6294
Test AUC: 0.9168
AUC Standard Deviation: 0.0248
#Background points: 5261
bio_12_etrs2_ras contribution: 16.9278
bio_15_etrs2_ras contribution: 1.7383
bio_18_etrs2_ras contribution: 3.0896
bio_4_etrs2_ras contribution: 47.2878
bio_8_etrs2_ras contribution: 1.1727
bld_m_sd1_1km_eu_ll contribution: 2.8954
cecsum_m_sd1_1km_eu_ll contribution: 0.1047
clyppt_m_sd1_1km_eu_ll contribution: 0.2259
crfvol_m_sd1_1km_eu_ll contribution: 4.1454
dist2water1km contribution: 0.0476
orcdrc_m_sd1_1km_eu_ll contribution: 0.8552
pet_he_yr contribution: 11.6802
phihox_m_sd1_1km_eu_ll contribution: 0.3306
sltppt_m_sd1_1km_eu_ll contribution: 0.4748
sndppt_m_sd1_1km_eu_ll contribution: 2.8708
solar_1km contribution: 6.1532
bio_12_etrs2_ras permutation importance: 11.098
bio_15_etrs2_ras permutation importance: 1.4671
bio_18_etrs2_ras permutation importance: 3.3948
bio_4_etrs2_ras permutation importance: 39.0025
bio_8_etrs2_ras permutation importance: 0.9225
bld_m_sd1_1km_eu_ll permutation importance: 2.9407
cecsum_m_sd1_1km_eu_ll permutation importance: 0.3514
clyppt_m_sd1_1km_eu_ll permutation importance: 1.0385
crfvol_m_sd1_1km_eu_ll permutation importance: 13.2838
dist2water1km permutation importance: 0.3511
orcdrc_m_sd1_1km_eu_ll permutation importance: 2.4478
pet_he_yr permutation importance: 15.1798
phihox_m_sd1_1km_eu_ll permutation importance: 2.9375
sltppt_m_sd1_1km_eu_ll permutation importance: 2.438
sndppt_m_sd1_1km_eu_ll permutation importance: 0.9287
solar_1km permutation importance: 2.2179
Entropy: 7.1344
Prevalence (average of logistic output over background sites): 0.1155
Fixed cumulative value 1 cumulative threshold: 1
Fixed cumulative value 1 logistic threshold: 0.0186
Fixed cumulative value 1 area: 0.5052
Fixed cumulative value 1 training omission: 0.0115
Fixed cumulative value 1 test omission: 0.0357
Fixed cumulative value 1 binomial probability: 5.91E-07
Fixed cumulative value 5 cumulative threshold: 5
Fixed cumulative value 5 logistic threshold: 0.0954
Fixed cumulative value 5 area: 0.3203
Fixed cumulative value 5 training omission: 0.0307
Fixed cumulative value 5 test omission: 0.0357
Fixed cumulative value 5 binomial probability: 1.40E-13
Fixed cumulative value 10 cumulative threshold: 10
Fixed cumulative value 10 logistic threshold: 0.1694
Fixed cumulative value 10 area: 0.2387
Fixed cumulative value 10 training omission: 0.0651
Fixed cumulative value 10 test omission: 0.1071
Fixed cumulative value 10 binomial probability: 2.35E-16
Minimum training presence cumulative threshold: 0.5143
Minimum training presence logistic threshold: 0.0103
Minimum training presence area: 0.587
Minimum training presence training omission: 0
Minimum training presence test omission: 0.0357
Minimum training presence binomial probability: 2.51E-05
10 percentile training presence cumulative threshold: 18.2675
10 percentile training presence logistic threshold: 0.2609
10 percentile training presence area: 0.1671
10 percentile training presence training omission: 0.0996
10 percentile training presence test omission: 0.1786
10 percentile training presence binomial probability: 8.34E-21
Equal training sensitivity and specificity cumulative threshold: 22.3303
Equal training sensitivity and specificity logistic threshold: 0.3025
Equal training sensitivity and specificity area: 0.1426
Equal training sensitivity and specificity training omission: 0.1418
Equal training sensitivity and specificity test omission: 0.2143
Equal training sensitivity and specificity binomial probability: 1.08E-22
Maximum training sensitivity plus specificity cumulative threshold: 18.2675
Maximum training sensitivity plus specificity logistic threshold: 0.2609
Maximum training sensitivity plus specificity area: 0.1671
Maximum training sensitivity plus specificity training omission: 0.0996
Maximum training sensitivity plus specificity test omission: 0.1786
Maximum training sensitivity plus specificity binomial probability: 8.34E-21
Equal test sensitivity and specificity cumulative threshold: 16.6662
Equal test sensitivity and specificity logistic threshold: 0.2475
Equal test sensitivity and specificity area: 0.1785
Equal test sensitivity and specificity training omission: 0.0958
Equal test sensitivity and specificity test omission: 0.1786
Equal test sensitivity and specificity binomial probability: 3.20E-19
Maximum test sensitivity plus specificity cumulative threshold: 36.3306
Maximum test sensitivity plus specificity logistic threshold: 0.4278
Maximum test sensitivity plus specificity area: 0.0842
Maximum test sensitivity plus specificity training omission: 0.2759
Maximum test sensitivity plus specificity test omission: 0.2143
Maximum test sensitivity plus specificity binomial probability: 4.69E-41
Balance training omission, predicted area and threshold value cumulative threshold: 3.5127
Balance training omission, predicted area and threshold value logistic threshold: 0.072
Balance training omission, predicted area and threshold value area: 0.3592
Balance training omission, predicted area and threshold value training omission: 0.0192
Balance training omission, predicted area and threshold value test omission: 0.0357
Balance training omission, predicted area and threshold value binomial probability: 1.25E-11
Equate entropy of thresholded and original distributions cumulative threshold: 10.0342
Equate entropy of thresholded and original distributions logistic threshold: 0.1695
Equate entropy of thresholded and original distributions area: 0.2384
Equate entropy of thresholded and original distributions training omission: 0.0651
Equate entropy of thresholded and original distributions test omission: 0.1071
Equate entropy of thresholded and original distributions binomial probability: 2.18E-16
- Hierarchy level
- Dataset
Reference System Information
Reference System Information
- Code
- EPSG:3035
Metadata
- Metadata identifier
- cb23d43e-5495-4ab9-861e-1c2d13db33e2
- Language
- English
- Character encoding
- UTF8
- Contact
-
Organisation Individual Electronic mail address Website Role European Environment Agency
Point of contact
Type of resource
- Resource type
- Dataset
- Metadata linkage
-
https://sdi.eea.europa.eu/catalogue/srv/api/records/cb23d43e-5495-4ab9-861e-1c2d13db33e2
- Date info (Creation)
- 2016-06-15T13:21:52Z
- Date info (Revision)
- 2025-10-09T11:15:00.312981Z
Metadata standard
- Title
-
ISO 19115/19139
- Edition
-
1.0
)))