 EEA geospatial data catalogue
Burden of disease of air pollution (Countries, NUTS regions and cities), tabular data (2005-2022)
This dataset presents the burden of disease from air pollution due to exposure to three main pollutants (PM2.5, NO2 and O3) at country, different NUTS and city levels.
The calculations are made for years 2005 to 2022. The concentrations data are taken from the ETC/HE interpolated maps (ETC HE Report 2024/4 and references therein). The methodology is as described in ETC HE Report 2024/6 and references therein.
Simple
Identification info
-
Date (Creation)
- 2024-09-10T14:41:14+00:00
-
Date (Publication)
- 2024-12-10T14:41:14+00:00
-
Edition
-
01.00
-
Citation identifier
- eea_t_aq-health-risk-nuts3_p_2005-2022_v01_r00
-
Citation identifier
- air-quality-health-risk-assessments-nuts3
-
Citation identifier
- DAT-287-en
Identifier
-
Purpose
-
km2
μg/m3
μg*days/m3
years of life lost
- Point of contact
-
Organisation Individual Electronic mail address Website Role European Environment Agency
Point of contactEuropean Environment Agency
Publisher
Spatial resolution
Equivalent scale
-
Denominator
- 100000
-
Topic category
-
-
Environment
-
Extent
Temporal extent
-
Time period
- 2005-01-01 2022-12-31
-
Maintenance and update frequency
-
Annually
- Continents, countries, sea regions of the world.
-
- North Macedonia
- Türkiye
- Serbia
- Montenegro
- Sweden
- Albania
- Portugal
- Iceland
- Kosovo (UNSCR 1244/99)
- Luxembourg
- Ireland
- Bosnia and Herzegovina
- Croatia
- Hungary
- Czechia
- Denmark
- Poland
- Norway
- Liechtenstein
- Netherlands
- France
- Slovakia
- Romania
- Switzerland
- Finland
- Cyprus
- Bulgaria
- Slovenia
- Malta
- Spain
- Germany
- Austria
- Lithuania
- Belgium
- Greece
- Italy
- Latvia
Resource constraints
-
Use constraints
-
Other restrictions
-
Other constraints
-
License CC-BY 4.0 ( https://creativecommons.org/licenses/by/4.0/). Copyright holder: European Environment Agency (EEA).
Resource constraints
-
Access constraints
-
Other restrictions
-
Other constraints
- No limitations to public access
-
Language
- English
-
Additional Information
-
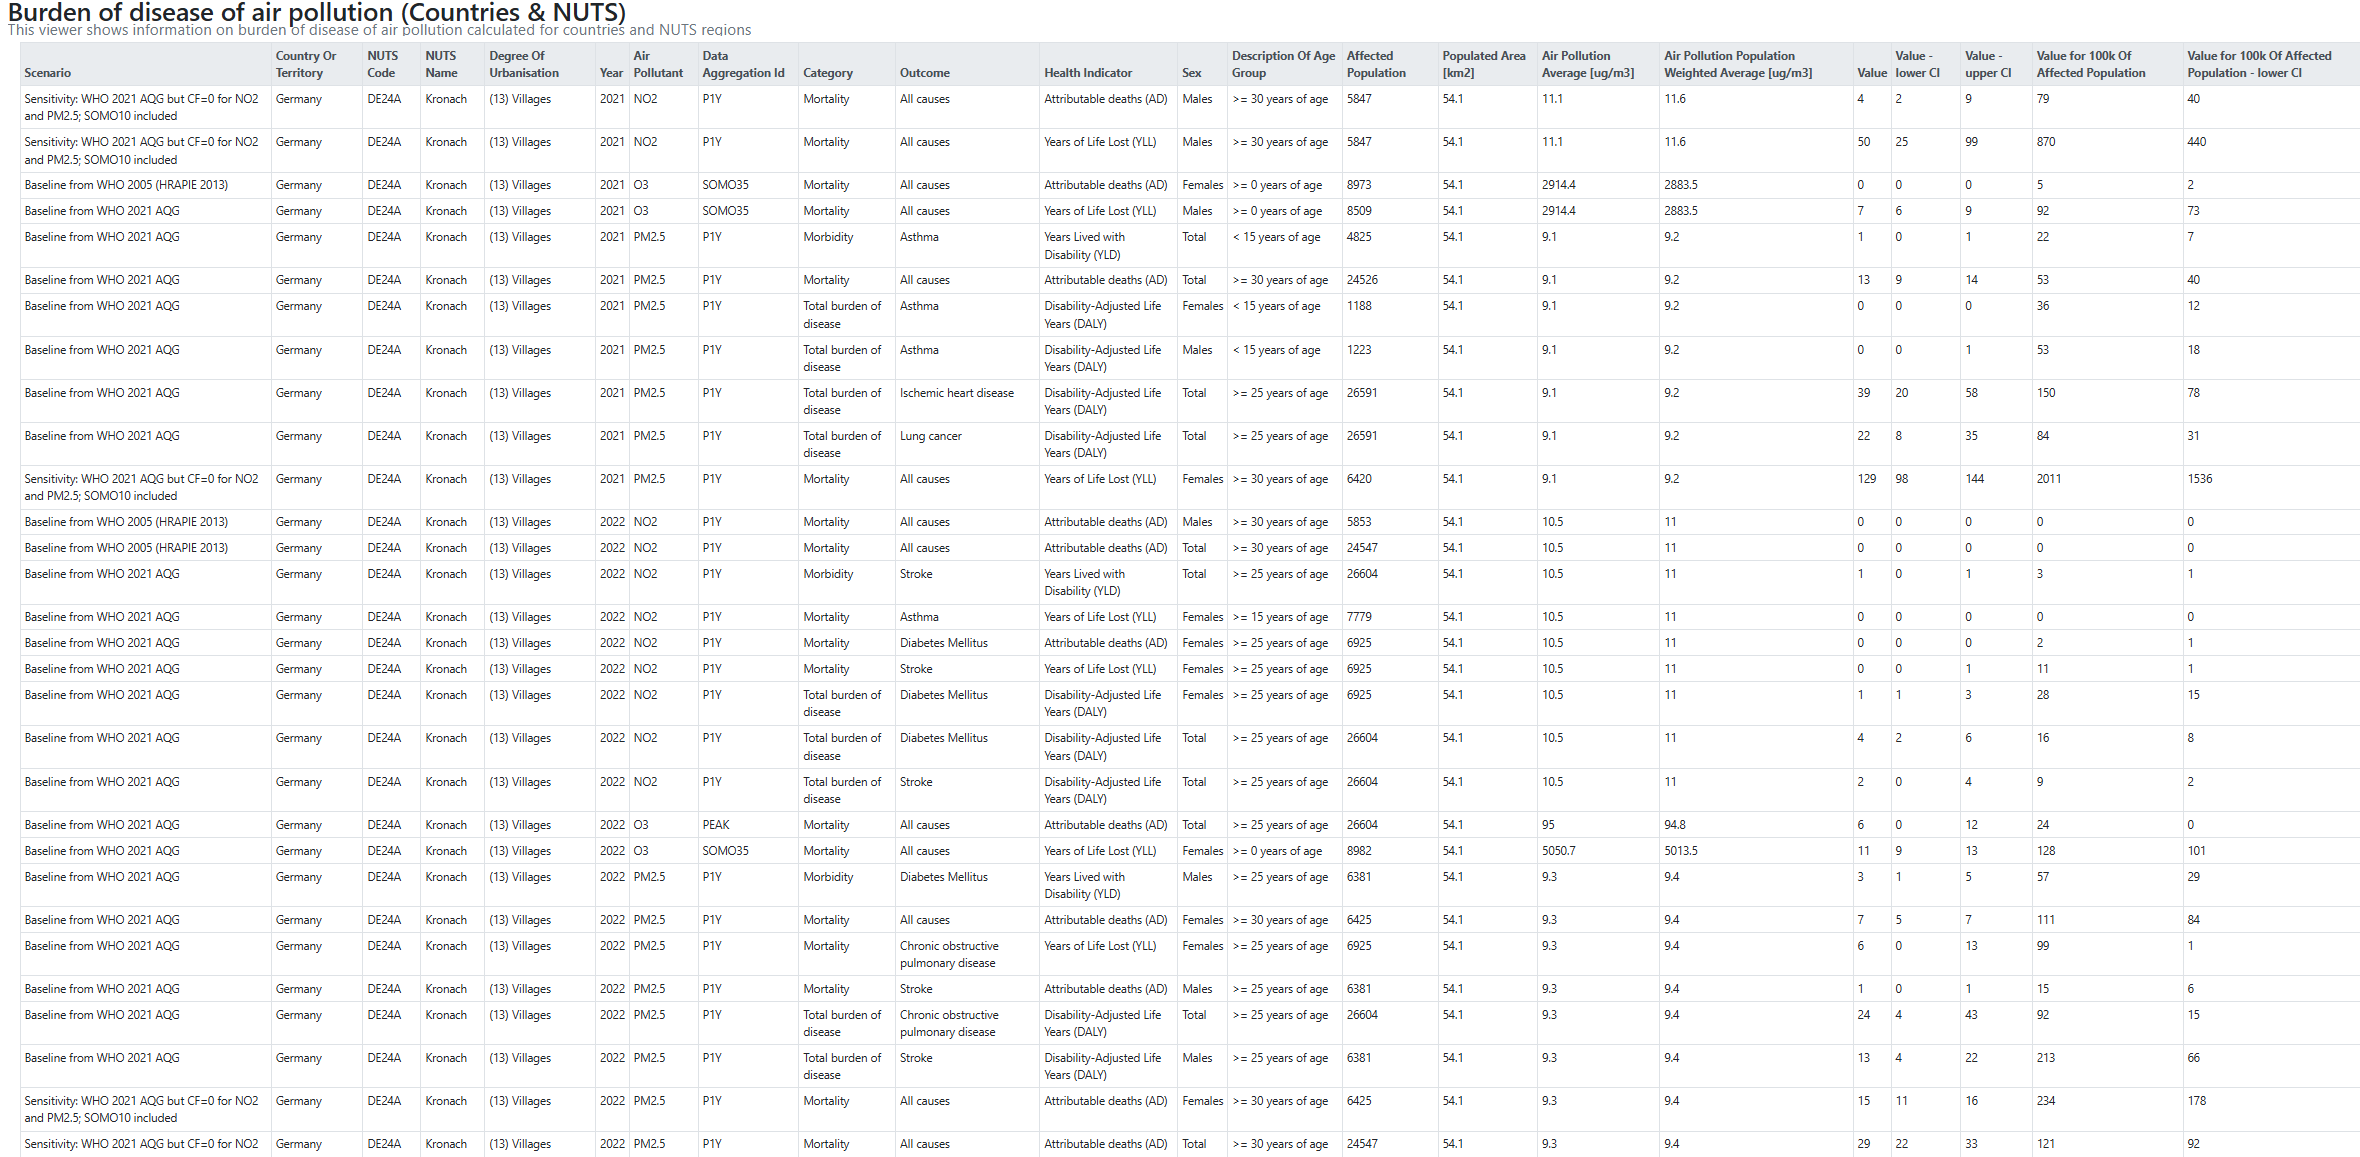
The two tables above present information on demographics; air quality; and mortality, morbidity and total burden of disease due to exposure to air pollution at different spatial levels, for 41 European countries (please be aware that for PM2.5, there are no data for Türkiye). Both show information on
- the spatial units considered:
- affected population and area,
- concentration average and population-weighted concentration (a measure of exposure), for fine particulate matter (PM2.5), nitrogen dioxide (NO2) and ozone (O3),
- different indicators of burden of disease: number of premature deaths, number of years of life lost, years lived with disability and disability-adjusted life years (with the corresponding 95% confidence intervals, indicated in the columns “lower CI” and “upper CI”) for the previous three pollutants.
The first table shows the information at i) country level for the 41 European countries and for three different aggregations (the 27 European Union countries; the 32 European Environment Agency member countries; and all the 41 (or 40) countries); and ii) NUTS1, NUTS2 and NUTS3 levels.
The second table shows the information for two types of cities: those defined in the Eurostat urban audit collection (available choosing “ESTAT Urban Audit Cities (LAU)” at the filter “City Boundary Specification (LAU/grid)”), and the DG Regio Urban Centres (through “Urban Centres (grid)” in the same filter).
All specific values of the tables can be changed in the specific filters, which are self-explanatory except for “Degree of urbanisation”, “Health Risk Scenario” and “Spatial unit detail”. The first filter, present in the first table, selects the corresponding spatial unit (country, or the specific NUTS regions) as a whole (“All Areas (incl.unclassified)”) or only the specific parts that correspond to the six defined degrees of urbanisation (“Mostly Uninhabited Areas”, “Dispersed Rural Areas”, “Villages”, “Suburbs”, “Towns” or “Urban centers”). Unless interested in the differences due to urbanisation, please always select “All areas”.
The scenario filter, present in both tables, represents the assumptions considered for the burden of disease calculations and correspond to the following:
- Baseline from WHO 2005 (HRAPIE 2013): the concentration-response functions are those defined in WHO, 2013, with counterfactual concentrations of 0µg/m3 for PM2.5, 20µg/m3 for NO2 and 70µg/m3 for O3 (SOMO35, short-term exposure). These are the assumptions used in the past EEA calculations.
- Baseline from WHO 2021 AQG: Concentration response functions as defined in WHO, 2021, with counterfactual concentrations of 5µg/m3 for PM2.5, 10µg/m3 for NO2 and 70µg/m3 for O3 (SOMO35, short-term exposure) and, since 2022, 60µg/m3 for O3 (peak season or PEAK, long-term exposure). These are the assumptions used by EEA for its main calculations and, for PM2.5, NO2 and the long-term exposure for ozone, represent the mortality that could be avoided if the corresponding 2021 air quality guideline levels had been achieved everywhere.
- A first Sensitivity scenario where the concentration response functions are as defined in Baseline from WHO 2021 AQG, but with counterfactual concentrations of 0µg/m3 for PM2.5, 0µg/m3 for NO2 and 20µg/m3 for O3 (SOMO10, short-term exposure). In this sensitivity analysis, the total mortality is estimated for PM2.5 and NO2, including also at low concentrations, even if for those concentrations the uncertainty of the estimations is bigger; and mortality above 20µg/m3 is estimated for short-term exposure to O3.
- A second Sensitivity scenario where the concentration response functions are as defined in Baseline from WHO 2021 AQG, but with counterfactual concentrations of 10µg/m3 for PM2.5, 20µg/m3 for NO2, that is, the new annual limit values included in the revised AAQD 2024/2881 and without any additional scenario for O3.
Finally, the filter “Spatial unit detail” in the second table specifies how the cities are represented: individually (“City specific”), aggregated by the country they belong to (“Urban Centres – Country Totals”), or aggregated for the total EU27, EEA32 or the whole set of countries available (“Urban Centres – Totals”). The last two options are only available for the Urban Centres, not for the urban audit cities.
Distribution Information
-
Distribution format
-
-
ascii (.csv, .txt, .sql)
-
-
OnLine resource
-
Burden of disease of air pollution (Countries & NUTS)
-
OnLine resource
-
Burden of disease of air pollution for cities and urban centres
Resource lineage
-
Statement
-
The methodology is as described in ETC/HE Eionet Report 2024/6 ( https://www.eionet.europa.eu/etcs/etc-he/products/etc-he-products/etc-he-reports/etc-he-report-2024-6-assessing-the-environmental-burden-of-disease-related-to-air-pollution-in-europe-in-2022) and references herein
The concentrations maps are available at the EEA's Datahub: https://www.eea.europa.eu/en/datahub/datahubitem-view/58747c05-5e7d-4d2a-90cd-a6ab46057fa0
-
Hierarchy level
-
Dataset
-
Source
-
- https://ec.europa.eu/eurostat/cache/metadata/en/hlth_cdeath_sims.htm
- https://ec.europa.eu/eurostat/cache/metadata/en/demo_mor_esms.htm
- https://ec.europa.eu/eurostat/cache/metadata/en/demo_mor_esms.htm
- https://ec.europa.eu/eurostat/cache/metadata/en/demo_pop_esms.htm
- https://ec.europa.eu/eurostat/cache/metadata/en/demo_gind_esms.htm
- European air quality data (interpolated data)- Series
Metadata
-
Metadata identifier
- 258fa83c-dec6-4d88-b1fb-959f2d90008f
-
Language
- English
-
Character encoding
-
UTF8
- Contact
-
Organisation Individual Electronic mail address Website Role European Environment Agency
Point of contact
Type of resource
-
Resource type
-
Non geographic dataset
-
Name
-
Tabular dataset
-
Metadata linkage
-
https://sdi.eea.europa.eu/catalogue/srv/api/records/258fa83c-dec6-4d88-b1fb-959f2d90008f
-
Date info (Creation)
- 2024-12-02T08:54:25.519876Z
-
Date info (Revision)
- 2025-12-01T08:18:50.689296Z
Metadata standard
-
Title
-
ISO 19115-3:2018
-
Edition
-
1.0

)